What Should Swiss Watchmakers Do About Smart Watches?

I have been wearing an Omega Seamaster daily for several years. But a few months ago, I switched to the Pebble Steel. Since then, the Omega watch has been sitting in the winder all the time because the Pebble gives me one thing really important: I am not missing any calls or meeting reminders any more.

In the past, I missed a lot calls and meeting reminders because the phone was put in vibration mode or I didn’t hear it ringing because of other noises. For example:

  • My phone was being charged in my office and I was talking to someone in the next door. Unfortunately, in the previous meeting, I turned it to vibration mode. I was so focused on the discussion and lost track of time. I missed the reminder of the next meeting and only realized it when it’s already half way through. I felt awful to be so much late to the meeting. Sometime the meeting had to be rescheduled due to my no show and it was me that wasted others’ time.
  • My phone was being charged in the family room when I was cooking dinner in the kitchen. The range hood was running right in front of me and I can’t hear anything else. My wife called me on her way home to ask me if I want her to pick up any grocery or bakery. I missed her call (and the first thing she said when she came in was “why didn’t you answer my call”).
  • My phone was in vibration mode and unfortunately put on an ottoman. The soft cushion of the ottoman absorbed all the vibrations when a call came in and I missed the call.
  • My wife and I were skiing and we put our phone in the pocket of the ski jacket. When the ski school called to tell us to pick up our boy earlier, we both missed the call. We couldn’t hear the ring because we had helmet. We didn’t feel the vibration because we were in motion and we had layers under the ski jacket.

Those are not happening any more since I got the Pebble. When there is an incoming call or meeting reminder, it vibrates and I can feel it because it’s tied to my wrist and touches my skin directly. But I am now in constant struggling. When it comes to the craftsmanship, the Pebble can’t compare to my Omega. The Omega Seamaster feels much better and looks much more beautiful.

Omega Seamaster

But I end up now wearing the Pebble everyday because it solves a big problem for me. So when it comes to “How should luxury watch brands like Rolex strategically respond to the launch of the Apple Watch?”, I hope they won’t try to wedge some crappy half-baked smartwatch features into their beautiful watches. On the other hand, I hope they can add two things to the traditional watches:

  1. Sync up with my phone and vibrate when there is a notification. Vibration would be enough. It doesn’t need to display anything. As long as I feel the vibration, I know I should check my phone.
  2. Have health sensors and send data back to my phone as how Pebble, Fitbit, Jawbone and soon Apple Watch do. I love to see how many steps I have walked each day, how long I slept last night and how many hours were deep sleep.

Well, adding these two things to my Omega Seamaster means adding battery to it and it needs to be charged every a few days. That’s OK with me. Even if I forget to charge the “smart Omega” and the battery runs out, it’s still a really nice Omega like what it is today. If Pebble or Apple Watch’s battery is dead, it will be a piece of useless metal, or a beautiful bracelet at the best.

Bottom line: as Michael Wolfe said, they should keep Rolex watches Rolex-y.

The Versioning Hell of Microservices

Recently in his blog post “Microservices. The good, the bad and the ugly”, Sander Hoogendoorn warned us about the versioning hell of microservices. He wrote:

“Another that worries me is versioning. If it is already hard enough to version a few collaborating applications, what about a hundred applications and components each relying on a bunch of other ones for delivering the required services? Of course, your services are all independent, as the microservices paradigm promises. But it’s only together that your services become the system. How do you avoid to turn your pretty microservices architecture into versioning hell – which seems a direct descendant of DLL hell?”

I wrote almost the same in an internal discussion late last year in my team. In my internal memo “Transient States Testing Challenge”, I warned that this problem is emerging as a component gets split into a few smaller pieces (aka. microservices), the testing cost may increase substantially and we must understand and prepare for it. Here is the full text of the memo (with sensitive details removed):


Before

When it was just a one piece, say it’s a service X, there would be no transient state. During the upgrade, we will put the new binaries of X to a dormant secondary. Only when the secondary is fully upgraded, we will promote it to primary (by switching DNS, like the VIP Swap Deployment on Azure) and the demote the original primary to secondary. That promote/demote is considered instant and atomic:

That promote/demote is considered instant and atomic

Looking inside the box, X consists of five pieces: say A, B, C, D and E. When each of the five teams is developing their own v2, they only need to make sure their v2 code can work with the v2 code of others. For example, team A only needs to test that A2 works with B2, C2 and D2, which is the final state {A2, B2, C2, D2}.

Team A doesn’t need to test A2 against B1, C1 and D1

Team A doesn’t need to do integration test of A2 with B1, C1 and D1, because that combination would never happen.

After

As we are splitting X into smaller pieces, each smaller piece will be independently deployable. The starting state and final state remain unchanged but because there is no way to strictly fully synchronizing their upgrades, the whole service will go through various transient states on the path from the starting state to the final state:

various transient states on the path from the starting state to the final state

In an overly simplified way (for the convenience of discussing the problem), there are two choices in front of us:

Choice #1: Only deploy the four of them in a fixed order, and only one at a time. For example, A->C->D->B and the transition path will be:

deploy the four of them in a fixed order

Therefore, in testing, not only we need to make sure {A2, B2, C2, D2} can work together, we will also need to test three additional states:

  1. {A2, B1, C1, D1}
  2. {A2, B1, C2, D1}
  3. {A2, B1, C2, D2}

The amount of additional states to test equals N-1 (where N is the number of the pieces). The caveat of this approach is that we are losing the flexibility regarding the order of deployments. If C2 deployment is blocked, D2 and B2 are blocked, too. That’s against agility.

Choice #2: Not to put any restriction on the order. Any piece can go at any time. That gives us the flexibility and helps agility, at the cost of having to do a lot more integration testing to cover more transient states:

  1. {A2, B1, C1, D1}
  2. {A1, B2, C1, D1}
  3. {A1, B1, C2, D1}
  4. {A1, B1, C1, D2}
  5. {A2, B2, C1, D1}
  6. {A2, B1, C2, D1}
  7. {A2, B1, C1, D2}
  8. {A1, B2, C2, D1}
  9. {A1, B2, C1, D2}
  10. {A1, B1, C2, D2}
  11. {A1, B2, C2, D2}
  12. {A2, B1, C2, D2}
  13. {A2, B2, C1, D2}
  14. {A2, B2, C2, D1}

The amount of additional states to test equals 2^N-2 (where N is the number of the pieces): N=3 -> 6; N=4 -> 14; N=5 -> 30; …. That’s getting very costly.

Possible Optimizations?

We could have some optimizations. For examples:

  • Among the four pieces (A, B, C and D), make some of them orthogonal, to eliminate the need of testing of some transient states.
  • Find a middle ground between following a fixed order vs. allowing any kind of order. For example, we can say A and B can go in any order between them and C and D can go in any order between them, but C and D must not start the upgrade until both A and B are finished. That will reduce the number of possible transient states.

But these optimizations only make the explosion of permutations less bad. They don’t change the fundamentals of this challenge: the need of testing numerous transient states.

Backward Compatibility Testing?

Another possible way to tackle this is to say that let’s invest in the coding-against-contract and backward compatibility test of A, B, C and D so that we can fully eliminate the need of testing the transient states. That’s true, but it brings in its own costs and risks:

1. Cost

By suggesting investing in backward compatibility test to get away with the testing of numerous transient states, we are converting one costly problem to another costly problem. As a big piece splits into smaller one, the sum of the backward compatibility test cost of all the smaller pieces is going to be significantly more than the original backward compatibility test cost when we have just 1 piece.

That’s just plain math. In backward compatibility test, you are trying to make sure the circle is friendly with its surrounding. When a big circle splits into multiple smaller circles while keep the total area unchanged, the sum of the circumferences of the smaller circles is going to be much bigger than the circumference of the original big circle:

the sum of the circumferences of the smaller circles is going to be much bigger

2. Risk

Only validating against contract can cause missing some very bad bugs, mainly because it’s hard to use contracts to capture some small-but-critical details, especially those behavioral details.

Testing in Production?

One may suggest that we do neither: not to test all the permutations in transient states, nor do that much backward compatibility testing between microservices. Instead, why don’t we ship into production frequently with controlled small exposure to customers (aka. flighting, first slice, etc.) and do the integration test there? True but still, we are converting one costly problem to another costly problem, since testing in production also requires a lot of work (in design and in testing), plus engineering culture shift.

What’s my recommendation?

No doubt that we should continue to move away from the one big monolithic piece approach. However, when we make that move, we need to keep in mind the transient states testing challenge discussed above and look for a balanced approach and the sweet spot in the new paradigm.

The Great Value of Knowing the Achievability

I have heard people say “Don’t tell me this is achievable. Tell me how to achieve.” So is it useless to know the achievability while not knowing how to? Not really. Knowing how to achieve will definitely make things more straightforward, but when you don’t know how to, there is still a great value to know the achievability.

Jared Diamond, in his book “Guns, Germs, and Steel: The Fates of Human Societies”, said that in the history, there were two ways how a society learned skills (e.g. grow wheat, tame cows, etc.) from another society in a nearby region:

  1. They learned the skills directly.
  2. They didn’t learned the skills directly, but they learned the achievability of certain things, then figured out the exact method by themselves.

For example, a society learned from a nearby society that cows are tamable and make good milk. They probably didn’t get to learn the exact method of domesticating cows from the nearby society, due to the language barrier, the nearby society’s unwillingness to share knowledge in order to keep competitive advantages, or whatever reasons. But having seen that the nearby society has successfully domesticated cows gave them the faith that cows are tamable and conviction to search for ways to do it. Also, this society wouldn’t potentially waste time trying to tame zebra or antelope. Jared pointed out that knowing which way is a dead end vs. which way can go through helped a lot of societies significantly shorten the time it took for them to advance their developments.

Knowing the achievability has great value in software engineering as well.

Speaking from my own experience. In my current group, a full test pass have about 4,000 test cases in total. When I joined, it took more than 24 hours to run and had only 80%-90% passing rate during most part of a release cycle. People were not happy with it but most of them seemed to think that’s just how it supposed to be. I told them no, it definitely can be much better. I told them that when I joined my prior group, things were in bad shape, too: it took >24 hours to run 12,000 test cases and similarly had only 80%-90% rate, but later we fixed it: the test duration shortened to sub-day (somewhere around 16-18 hours) and the failure rate dropped to low single digit %. I kept repeating this to everybody, telling them that since it was achieved in my prior group, we must be able to achieve it here as well. I also told them to have the right expectation of time: in my prior group, it took more than a year to fix it, so we should also anticipate similar amount of time to fix it here.

Knowing the achievability helped. Knowing approximately how long it will take to get there also helped. My team committed to improve the test efficiency and agility and made small and big investments one after another. After about 15 months, we were able to finish the same full test pass in just 7.5 hours. After about 2 years since we started the endeavor, 98-99% passing rate has become the norm. Had we not known the achievability, my team probably would have hesitated to make the investment, or pulled some resource out in the middle of the endeavor, due to having not (yet) seen the light of the end of the tunnel.

Experience (Still) Matters

In my 10+ years’ experience in software engineering, I have seen that for many times, seemingly good (or at least harmless) ideas, from architecture design to engineering process, caused severe problems after several years. Some of them repeated multiple times or happened in more than one group. So I learned that those are things to avoid.

For example, I learned that in service oriented architecture (or microservices, to use the latest buzz words), 1-to-1 relationship between services is a bad design. It usually doesn’t seem harmful in the v1 stage, but it always causes pain in the ass down the road. I shared this learning in Azure last year and it was also shared by Mark Russinovich in 2014 //BUILD conference (“Avoid Cloud Fail”, slice 16-18 in his deck): “Rule: make components capable of talking to multiple versions concurrently”; “Use registration with ‘return address’ pattern”; “Adheres to layering extension model where dependencies are one way”.

The challenge that I have is when I share my learning with people and advise them to do things differently, some of them don’t seem to be able to take the digested knowledge very well, especially when it’s against their intuition. Sometimes it would take quite a lot explanations to help them see why a seemingly good idea is actually a bad idea. It’s like playing the chess. In middlegame, a seemingly wise move may cause a devastating consequence in several steps later. An experienced player A can quickly foresee this and advise the less experienced player B not to make that move. Although B is a world champion poker player, due to having less experience in chess, he is not able to see the trap that far away. To explain it to B, A needs to show B step-by-step how will that move play out. In real life, some people in B’s position are lack of respect of A’s experience, doesn’t trust A’s digested knowledge and are not willing to listen to A’s explanation.

For the worse, under the name of being data driven, some of them feel they are doing the right to reject the digested knowledge because it’s not backed up by data. Of course it’s not. It’s not always practical to have as much data. As we move from one project to another, from one company to another, we lose the access to the detail information of the past projects. So it’s very common that we only have the conclusions (e.g. “1-to-1 relationship is a bad design”), and can briefly talk about what happened in the past at a high level, but couldn’t present any charts with a lot of numbers, any bug details, or side-by-side performance data comparison. A truly learning organization shouldn’t and wouldn’t let the pride of their data culture get in the way of learning from the others’ past experience.

Data driven is good (and popular these days), but experience still matters (a lot). As organizations have more metrics and push for data driven design and decision making, they should continue to respect and value experiences. Because experience (or digested knowledge) is the main way how we learn in our life. We were told by master investors that patience is important and buy-and-hold works. We were told that a rule of thumb in real estate is “location, location, location”. We were told that vaccines are safe and children should get vaccination. We don’t ask for data behind these. We know these wisdom came from decades of research, practice and experiments. It’s silly to ignore these only because “I haven’t seen the data”.

The Abuse of “I am Blocked”

For many times when I see someone says “I am blocked”, I want to ask them: “In what sense?” In many cases, they are not truly fully blocked. It’s just one of their projects has paused, waiting for another thing to finish to continue. For the time being, they could have worked on other projects before the “blocked” one is unblocked.

Too much “I am blocked” is an indicator that the person is unwilling or incapable of adjusting course as needed. It’s much easier to say “I am blocked” than to put thoughts in how to shuffle the original schedule and re-prioritize work items, which requires additional brain cycles. It’s easier to blame others: “I can’t get my job done because I am blocked”.

When I closely examine some organizations where there are a lot of “I am blocked”, I also find some engineering culture problems behind it. In those organizations, people try to impress their management by promising more things (than what they can deliver). Therefore, during the development cycle, they are overbooked. They can barely keep up with their own original commitments and have little time left to help others. As people have hard time to get traction when they need unplanned work from each other, they exaggerate, hoping that saying “I am blocked” can help get some traction.

In engineering teams which use agile development, it’s more likely to hear people say “I am blocked”. It’s not that agile development is the culprit. It’s mainly because many people mistakenly think agile means they only need to think about what to do in the current sprint and not need to worry about the next sprint at all. When the next sprint comes, they start to realize some critical dependency is not ready. So they scream “I am blocked”.

In an organization where “I am blocked” is abused, it becomes harder for people to differentiate which one truly needs help immediately and which one can wait. It’s like if everybody calls 911 to say “I am dying”, it will be hard for 911 to decide whom to send ambulance to first. In the real life, 911 may ask a couple questions to find out whether the man is truly in danger or just in panic. In engineering teams, asking such probing questions may be seen as unwilling to help and bureaucracy: “why waste time asking so many questions, rather than just fix it for us?” It just makes the team culture more unhealthy.

In my observation, high efficiency people are much more unlikely to say “I am blocked”. They know how to keep themselves productive. Likewise, an efficient manager knows how to keep his team productivity and keep making progress. They also plan ahead really well. They anticipate that they will need some thing from the other team six weeks from now. So they make the request to that team six weeks earlier, which in turn also helps that team to better arrange their work. If everybody can do more delicate coordination and planning, better tracking and early communicate, there will be less “I am blocked”, projects will be less stressful and the team culture will be healthier.

How to Randomly Generate Test Cases for a HasCycle() Method

For many times, I found that testing a solution could be equally hard as writing a solution, if not harder. Here is an example: how to randomly generate test cases for a HasCycle() function.

HasCycle() is a coding question that I used for many times in the past: write a function to detect whether there is a cycle in a directed graph. Some candidates finished the code pretty quickly, so my follow-up question would be “how would you test it”. For those who manually enumerated test cases quickly and thoroughly, my next question was “how would you randomly generate test cases”.

A wrong answer would be to write the solution again, say HasCycle2(), and see if HasCycle() produces the same results as HasCycle2() does for any randomly generated directed graph. That’s a wrong method because it’s circular proof: using this method requires the proof of HasCycle2() being fully correct, which is the same as to prove HasCycle() being fully correct. Someone argued that he could write HasCycle2() in a different algorithm to make it not a circular proof. No, that would be still a circular proof, just in a disguised form.

There wasn’t a satisfactory answer by any candidate, as far as I remembered. To be honest, I didn’t know the answer in the first place, either. It wasn’t about the answer itself, anyway. It was mainly to figure out how the candidate approaches problems. As long as the reasoning is sound, it would be cool if the candidate told me “no, there is no way, because blah blah blah”. But soon I started to think: to be fair, maybe I should figure that out myself first, to make sure either there is an answer, or the answer is “no, there isn’t an answer”.

I did come up with a way to randomly generate test cases for HasCycle(). Here are the steps:

  1. Pick a random integer N. Create a N-nodes directed graph with no arcs.
  2. Pick a pair of nodes X and Y randomly, as long as there isn’t an X->Y arc in the graph.
  3. Add an X->Y arc to the graph and color it as blue.
  4. Add the red arcs, too. A red arc is the last arc to form a cycle, in which all other arcs are blue.
  5. Repeat 2-4 for a random number of times (or until there is no more blue arc can be added)
  6. On the outcome of (5), just remove all the red arcs and the nodes and the blue arcs will become a graph without cycle. Pass it into HasCycle() and it should return false.
  7. Or, on the outcome of (5), randomly change the color of one or many red arcs to blue. Remove the remaining red arcs. The nodes and all the blue arcs will become a directed graph with cycle. Pass it into HasCycle() and it should return true.

The crux is how to identify which red arcs to add in step (4). Here is how:

  1. Get all the nodes that are reachable from Y by blue arcs, including Y itself, and put them into a list from-Y. This can be done by a simple traversal, following the blue arcs draining from Y.
  2. Similarly, get all the nodes from which X is reachable by blue arcs, including X itself, and put them into a list to-X. This can be done by reverse-traversal on the blue arcs sinking into X.
  3. For each node i in from-Y and each node j in to-X, create a red arc i->j.

Use an example to illustrate how this works:

First, randomly pick N=11, to generate a 11-nodes directed graph with no arcs:

fig.1

Add the first blue arc: A and K are randomly picked. A blue arc A->K is added. At the same time, a red arc K->A is added. K->A is red because it will form a cycle together with a blue arc A->K:

fig.2

Add the second blue arc randomly: B->A. This time, not only A->B should be added as a red arc (because A->B and B->A together will be a cycle), but also K->B should be added ad red arc as well, because B->A, A->K and K->B will be a cycle:

fig.3

Keep doing this. When G->H is added as blue arc, three red arcs need to be added: H->G, H->A, H->B. Because each of them will form a cycle with other blue arc(s):

fig.4

Now let’s examine a more general example of how to add red arcs. This time, a blue arc G->F is randomly added:

fig.5

In this case, from-Y is F, C, E and to-X is G, A, B. So we should add nice arcs: F->G, F->A, F->B, C->G, C->A, C->B, E->G, E->A, E->B:

fig.6

fig.7

fig.8

So the outcome of step (5) is this:

fig.9

Now, if we want a random graph without cycle, we just need to remove all the red arcs:

fig.10

If we want a random graph with cycle, we will randomly convert one red arc to blue and remove all the rest red arcs. For example, we convert C->A to blue. That will give us a cycle A->G->F->C->A:

fig.11

fig.12

I believe this method doesn’t have any blind spot. Given enough time, it should be able to generate all possible kinds of directed graph, with 0, 1 or multiple cycles.

//the end

Do Something Well, for Its Own Sake

When it comes to “What makes a good engineering culture”, among many other things, one thing should be on the list: the desire to do something well, for its own sake.

Not for delighting customers, not for showing off, not for making metrics look good, not for bonus and promotion, not for passing code review, not for meeting manager’s requirements, not for not looking bad. Just for its own sake.

Why? Because in software engineering, there are so many places and so many ways to cut corners without being easily noticed. We can save some time by not double confirming the numbers and facts which we use to back a decision, by closing a resolved bug without really seeing it passing in the exact condition as described in the bug report, by making a one-time mitigation in live site to just make the problem gone, without capturing the steps into a troubleshooting guide (not to mention to automate it).

Those behaviors can cause big hidden damages to the team:

  1. Bad money drives out good. People who cut corners like that will get more work done in the same period of time, compared to those who really do things well. Over the time, the latter are less reward and get promoted more slowly.
  2. Drags down the whole team’s productivity. Often times, if a person saves 10 minutes work (because he is tired in the evening, he doesn’t want to miss the shuttle bus, etc.), later, many other people in the team will have to spend extra minutes each and it adds up to be way more than 10 minutes. The team ends up losing hours of time to save 10 minutes.
  3. Makes it harder for the team to learn from its mistakes. The damages or cost of those corner-cutting may only start to emerge after a year or two. When the damage happens, it would be harder to connect back to what was done wrong in the first place.

The desire has to come from deep in people’s heart, from each individual’s own value system. The benefit of doing things right are either intangible, inquantifiable and unmeasurable (hence hard to be justified and rewarded), or will only be seen in long term. It takes some altruism. In the opposite, the benefit of cutting corners are tangible, measurable, immediate and self-benefiting, which goes well with the self-interested nature of human being.

How does it reconcile with “Perfect is the enemy of good”? I don’t think they are contradicting. They are balancing each other. “Perfect is the enemy of good” is about optimization and maximizing the overall return. It really bothers me to see people cutting corners and lowering the bar in the name of “perfect is the enemy of good”.

Be a Lifelong Learner

Note: someone asked “what happens to older programmers?” on Quora. I wrote this answer.

My few cents:

1. We all need to acknowledge that age discrimination exists and is bad (more reading: “What it Feels Like to Be Washed Up at 35“). People have acknowledged the gender gap in tech industry, but not that much of age discrimination.

2. I’ve worked with several older programmers (in their individual contributor role) in recent years. They are good, as good as other colleagues in any age. Some work on service products and do on-call (aka. pager) the same way as the young folks (those in 20s). I see age is just like other attributes like gender and race. They are orthogonal to job performance.

3. It is fair to ask about “why this guy is in the same job level as other folks who are 20 years younger? Shouldn’t he/she have advanced his/her career quite a lot in the last 20 years?“. To some extent, that’s something the recruiters and hiring managers better probe, because that’s about a person’s growth trajectory. Past trajectory is a useful reference to evaluate a candidate’s future growth potential. When looking for the answer of that question, it’s important to use unbiased eyes. There could be many reasons. For example, the candidate has flatten at a senior job level, which may be OK to some employers. The candidate may have chosen to much slow down his career advancement in exchange for other things like taking care of sick family member. The candidate may be relatively new to the profession, though he/she is relatively older. That happens. Some people switch profession in 40s. They deserve a fair chance.

4. Although it’s true that there can’t be that many management positions, it’s understandable and OK for many young programmers to want to be a manager in the future. Just like it’s understandable and OK for many kids to want to be the President of the United States, although there can’t be that many President positions (usually there are only 1 in every 4 years). Over the time, among those young programmers who want to be a manager, some of them will become managers, while some others will figure out that either manager is not the right job for them, or they are not (yet) the right person for the manager job.

5. Many people believe that older people are not suitable, at least not competitive, for the programmer job. Their reasons are usually about the energy level, the physical fitness, the need to spend time on kids, the fast evolving technology landscape, etc.. Except for the last one (fast changing technology landscape), all the other reasons are obviously irrelevant or trivial at the best. Take truck driver as example. Truck driver is a relatively physically demanding job. It’s intuitive for people to ask “what happens to older truck drivers”. People may think that young drivers are more productive because they may be able to go on for longer hours between rests. They may think young drivers have the advantage that they don’t need to spend time on kids. Similar to how people view young programmers vs. old ones.

But according to online data (File:Truck driver workforce by age.PNG), there is a large portion of older truck drivers and the number is somewhat growing over the last 10 years (see the 55-64 and 65+ age groups):

Truck driver workforce by age

None of the consequences due to aging, neither the physical ones (e.g. declining memory) nor the social ones (e.g. time spent on kids), would be a problem to the programmers in general.

6. Regarding the fast evolving technology landscape. Actually that may be just a perception or a partial view rather than full truth, depend on how you look at it. It’s true that we used to have no more than a handful choices of databases (Oracle, SQL Server, DB2, MySQL, PostgreSQL, Sybase) but now there are countless choices of databases, most being NoSQL databases. On the other hand, if you look at The Top 10 Programming Languages, the top guys are all decades old: Java, 20 years; C, 43 years; C++, 32 years; PHP, 20 years. Even C# has 15 years already. Although every a year or two there are new language features and new programming frameworks for these programming languages, those are just the normal needs of continuous learning as also seen in many other professions: accountants are faced with tax code and regulation changes every a couple years; for teachers, course books keep changing and in particular, there is the new Common Core; etc. In general, to be successful in any profession, one needs to be a lifelong learner.

Monitoring and QA are the Same Thing? (Part 3)

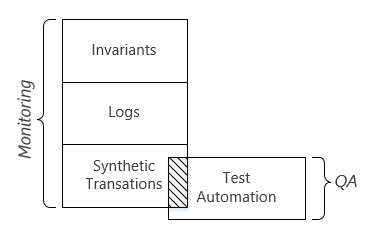
In Part 2, I pointed out that live site monitoring is about answering two questions: “is everything working?” and “is everything healthy?”, and invariants, metrics/logs and synthetic transactions are the three ways to find out the answers.

For those who are building/using/improving live site monitoring, besides how to find out the answers, they also need to be aware of and consider the following four aspects:

I. Knowing what has changed in production helps the monitoring more effectively answer “is everything working” and “is everything healthy”.

Some changes are triggered by human. For example, a code change or a configuration change. Pragmatic data shows that about 2/3 live site incidents were triggered by code changes and configuration changes (including the situation of a pre-existing bug, which may continue to remain dormant, until it’s triggered/surfaced by a new version rollout or configuration change). So after rolling out a new version or having flipped on/off a configuration setting, we want to get the answers the sooner the better (it’s Ok and reasonable to first have some preliminary assessment quickly, then take a bit more time to get a fuller assessment). Similarly, when a live site issue is fixed, we also want to get the answer ASAP to confirm the fix. When there are manually triggered changes, we know about the delta (in code or in configuration), so that we may first look at the areas related to the delta when trying to answer “is everything working” and “is everything healthy”.

Some changes are not triggered by human. They are just naturally happening as time goes by, or under the influence of the external environment. For examples: the message queue length grows as incoming traffic picks up; the data store size grows over the time; a system is slowly leaking resources; password expired, certificate expired, customer accounts are deleted by an automatic backend job after 90 days non-payment, etc.. Some of such changes can build up very quickly, such as a surge of simultaneous connection count during men’s ice hockey semifinal between the USA and Canada at the 2014 Winter Olympics. Knowing what are changing even when no one is touching the system, it helps target the monitoring more precisely.

II. Understand the confidence level of the answer.

Anyone can give an answer to the question “is everything working”. I could answer “yes” out of my ignorance (“I haven’t heard about any incidents”). That’s a legitimate answer, but a very low confidence answer. When it comes to live site monitoring and answer the questions “is everything working” and “is everything healthy”, we need the answers to be in higher confidence, to reduce false alarm or false positive.

The bar of “high confidence” may vary. For example, we may tune the monitoring system to be a little bit more conservative during the nights, so that we don’t wake people up too easily and prematurely. We could be more aggressive (lowering the bar) during working hours or special occasions (e.g. the winter Olympic).

Time is the key factor for a monitoring system to gain confidence on the answer (either positive or negative). For a slow-building issue, it usually takes hours or days to confirm it. To differentiate between a jump vs. a single spike, it needs to collect the data for a bit longer. In live site monitoring, we often quickly do a sanity check to give a preliminary answer (low confidence), then spend more time to be sure (higher confidence).

In one word, it takes time to get higher confidence. That’s why shorter MTTD (mean time to detect) and low noise ratio is mutually exclusive in general. That seems pretty obvious here. But in reality, many people can forget that in day-to-day work, especially in complex context. I have seen that as a common pitfall. People make designs which try to get shorter MTTD and lower noise ration at the same time. Some leadership sometimes challenge the team to improve both — it’s not unachievable, but harder than most people think.

III. Understand the different levels of turnaround time (usually as referred as MTTD, mean time to detect) and understand what kind of monitoring approach (invariants, metrics/logs and synthetic transactions) we should invest in to either move into a higher level of responsiveness or improve within the same level.

The basic level of turnaround time is to know the issue after customers have run into it. Synthetic transactions may not be the best place to invest in, if we want to shorten the time from the first several customers have hit the issue to the time we know about it. Instead, we should more rely on detecting anomalies and outliers based on aggregated logs.

It will be better if we know the issue before it affects any customer. That’s a much better turnaround time. In order to get ahead of the customers, we must use the synthetic transaction approach. The other two approaches (invariants and metrics/logs) cannot help when there is no customer impact yet. However, as pointed out in Part 2, synthetic transaction can become very expensive if we want to use it to cover more granular cases. Which means, to balance the cost and benefit, it will be more practical and realistic to only invest in catching major problems ahead of customers and let the issues in granular cases be there until some customers are affected. In the other words, catching all the live site issues ahead of customers should not be the North Star.

Some may say, shouldn’t the most ideal turnaround time be the negative turnaround time: detect the issue even before it exists in production. Of course that’s even better. But that is no longer a live site monitoring thing. Preventing issues from getting into live site is a QA responsibility, a software testing things.

IV. How will the answers be delivered?

Many people equals this to sending alerts. But sending alert is just one way to deliver the answers of “is it working” & “is it healthy”. There are many other delivery mechanisms. Some groups have a big flat screen TV on the way in their hallway, which shows a bunch of real time numbers and charts. When any issue happens, the numbers would turn red or flashing and the bar/line in the chart will shoot up high. Then it will get noticed by people who walk by. Such a flat screen TV is also a mechanism to deliver the answer. Sometime the answer is delivered without being request, such as when some thresholds are breached in the night, the on-call person will be called.

The differences between the delivery mechanisms are:

  1. Is the delivery guaranteed? Flat screen TV is not a guaranteed delivery, since we can’t make sure the right people will just walk by and noticed the red numbers. Emails and text messages are not guaranteed delivery, either. People may not be checking email and text message all the time. Calling on-call person’s cell phone is a guaranteed delivery: unless the on-call person answers the phone call, the call will be retried multiple times, and fall back on to the secondary on-call and the backup on-call, until someone answers the phone.
  2. Is the delivery explicit or implicit? Implicit: no bad news is good news. Explicit: we still want to keep receiving good news (“yes, everything is working fine in the last 30 minutes”), in order to have the peace of mind about the delivery channel (to avoid wondering whether there is no bad news, or the bad news got lost on its way?).
  3. How soon/fast is the answer delivered? It depends on factors including: how bad it is (severity, impact assessment); how much are we sure about it (confidence level). Usually there is a conflict between confidence level vs. how soon: we can aggressively send alerts, at the cost of high noise ratio, or we tune the monitoring system to wait until it’s very much sure about the issue before sending the alerts, at the cost of longer MTTD (mean time to detection).
  4. Who is the recipient? Phone call is a guaranteed delivery, but only one person will receive it at a time. Emails can be sent to a group of person of our choice. Flashing screens in the hallway will be seen, but we don’t know who exactly will see it. We also want the message get delivered to the right people, who need to know and/or can do something about.

Among all the ways, no one is the best way. There is only the right way, in different situations. “Right” = deliver the message to the right audience, with the right balance between shorter delay and higher confidence level, and containing the right level of details and actionable data.


Summary: this blog series (Part 1, Part 2, Part 3) captures the mind model that I use to look at live site monitoring. This model helps me better see the context of each topic related to monitoring, see where they are in the bigger picture and how they relate to each other.

//the end

Monitoring and QA are the Same Thing? (Part 2)

In Part 1, I mentioned that there are three monitoring approaches: a) invariants, b) metrics/logs, c) synthetic transactions. Here I like to explain them.

Before I do, I want to put them in a broader context: what is live site monitoring about. In my opinion, live site monitoring is about answering two questions:

“Is everything working?” & “Is everything healthy?”

There is a subtle but important difference between working vs. healthy: working = producing expected results (in terms of correctness, latency, …); healthy = being in a good condition (in order to remain working in the future).

A few real life examples may help elaborate the difference between working vs. healthy:

  1. A car is driving (working), but water temperature is running high (not healthy, it may break down soon);
  2. A team is shipping product on time (working) but people are burned out (not healthy), or, people have good work/life balance (healthy) but are not delivering (not working);
  3. An ATM machine can still spit money (working), but it’s low on cash (not healthy);
  4. A Web server is serving requests fine (working), but its CPU is at 70% on average (not healthy), or, it’s returning “Internal Server Error” pages (not working) though its CPU is below 10% (healthy), or it’s running on high CPU (not healthy) and not responding to requests (not working).

The three approaches (invariants, logs and synthetic transactions) are the three different ways to find out the answer to the first question, “is everything working”:

a) Invariants. That’s the laws of physics. Invariants are the evaluations that should always be true. When an evaluation is not true, there is something wrong in somewhere. For examples,

  • It should always be true that the current balance equals to the previous balance – all spending since last + all income since last. If those numbers don’t add up, something was wrong or missing.
  • If 200 is the hard ceiling of the number of virtual machines every account can have, and if some report says an account has more than 200 virtual machines, something must be wrong.

b) Metrics & Logs. Not just the trace and event logs, but also more importantly, the aggregated data. The log of every transaction can be aggregated at various levels on different dimension (per region, per OS type, per minute/hour/day/week/month/quarter, …). Then we can analyze it to catch the anomalies and outliers. For examples,

  • The API foo usually have 0.05% failure rate, but in the last 5 minutes, its failure rate was above 1%.
  • In the last several weeks, the mean time to provision a new virtual machine was 4 minutes and the 99th percentile was 15 minutes. But in the last several hours, the mean time to provision a Extra Large size Windows Server 2012 R2 virtual machines jumped to more than 20 minutes, although the overall mean time remain unchanged.

The approach of detecting anomalies and outliers based on aggregated logs has some limitations:

  1. It won’t help much when there isn’t enough data. Low data volume can be due to various reasons: in a new instance that haven’t been opened up to all customers, the traffic is low and there isn’t a lot of historical data to establish a benchmark; some APIs are low volume by nature, such as only a few hundreds calls per day; etc..
  2. It may not be able to tell the full picture of how the system is perceived from outside. For example, when the API calls are blocked/dropped before they have reached our service, we won’t have any log about those calls. (Note: however, a sudden drop of API call volume is an anomoly that can be caught through log analysis.

c) Synthetic Transactions. This is the most straightforward one: if the bank wants to know whether an ATM machine is working, they can just send someone to withdraw $20 from that ATM machine.

The synthetic transactions approach has some limitations, too:

  1. Representativeness. Even if the bank employee can withdraw $20 from that ATM machine, it doesn’t guarantee all customers will be able to, too.
  2. Cost. If the bank uses this way to monitor all its ATM machines (could be thousands) are working, they have to send people to withdraw $20 from every ATM machine every hour. That will be huge amount of labor cost and millions of dollar getting withdrawn by bank employees which also needs to be returned to the bank.
  3. Blind spots, as explained in Part 1.

In the case of monitoring ATM machines, the approach of detecting anomalies/outlier based on aggregated logs will be much more effective. As long as the log shows that in the last a couple hours customers have been able to successfully withdraw money from an ATM machine, we know this ATM machine is working. On the other hand, for a busy ATM machine (e.g. sitting at the first floor of a busy mall), if the log shows that there is no money withdrawn in the last two hours between 2pm-4pm on Saturday afternoon, the bank has a reason to believe the ATM machine may not be working and better send somebody over there to take a look.

To be continued … (Part 3)

Monitoring and QA are the Same Thing? (Part 1)

Many people think monitoring and QA are the same thing. They suggested that ultimately, we should be able to run the same QA test automation in production, as a monitoring approach to verify whether everything is working. Some said,

“your monitoring is doing comprehensive semantics checking of your entire range of services and data, at which point it’s indistinguishable from automated QA.”

I kind of disagree with that. For two reasons:

Reason 1. There are three monitoring approaches: 1) invariants, 2) metrics & logs, 3) synthetic transactions. By suggesting that monitoring and QA test automation are the same thing, people are equaling monitoring to synthetic transaction. However, the synthetic transaction approach is not sufficient to the need of live site monitoring. Synthetic transactions has some limitations:

  1. Representativeness. The fact that the test automation can provision a virtual machine in production doesn’t guarantee all the users can do so too.
  2. Cost. Every time the test automation provisions a new virtual machine, there is a cost on the system across the layers. As we increase the coverage of the monitoring and reduce the MTTD (mean time to detect), such overhead will become significantly a lot. In other words, using QA test automation for monitoring is not very economic. Plus, the cost will exponentially increase and the marginal return of investment will drop as we use synthetic transactions to cover more granular scenarios. In the past, I have seen for multiple times that groups went down such a slippery slope:
    • In the beginning, the team’s live site monitoring only provision one Small size Windows Server 2008 virtual machine in West US every 10 minutes.
    • Later, there happened a live site bug which only affected virtual machines running Windows Server 2012 OS. So instead of only covering Windows Server 2008, the team changed to cover all the OS types, including a few mainstream distro of Linux. That increased the number of synthetic virtual machines from one per 10 minutes to a half dozen per 10 minutes.
    • There happened another live site bug which caused virtual machine provisioning failing in some regions but not the others. Unfortunately, the synthetic transactions didn’t catch it because it only creates virtual machines in West US. Then the team changed to cover all regions rather than just West US. That increase the number of synthetic virtual machines by another 10x.
    • The team was challenged to reduce the MTTD. They figured that 10 minutes interval was too long and they reduced it to every 5 minutes. That doubled the amount of synthetic virtual machines.
    • The team also ran into a live site issue that only affects A8 and A9 sizes. So on and so on. In a year or two, the number of synthetic virtual machines increased from 1 to 100s.
  3. Blind spots. By running synthetic transactions, you will verify the scenarios that you know about and catch issues in these scenarios. But there are other scenarios (often corner cases) that you don’t know about or you don’t think it would be different. Hence, synthetic transactions won’t cover those scenarios and those are the places where some nasty live site incidents happened.

I believe that in live site monitoring, the other two approaches (logs and invariants) are needed to compensate these limitations of synthetic transactions. The three approaches are all useful and we need to effectively choose one or a combination of two or three for different purposes.

Reason 2. There are some important differences between the synthetic transactions used in monitoring vs. the test cases in QA test automation. By suggesting that monitoring and QA test automation are the same thing, people are equaling synthetic transactions to QA test automation. That’s not the case. Leaving aside the fact that not all the test cases can run in production, not all the test cases need to run in production. Just for a couple examples:

  • In QA test automation, a test case will verify that provisioning a new virtual machine must fail when the size is not among the supported sizes list (e.g. the output of ListSizes API call). Once our code have passed this test case in the in-house test pass, we believe it will behave the same way in production.
  • In QA test automation, a test case will verify that a customer can create a new virtual in the new A10 size if and only if the customer has enrolled in the “LargeVirtualMachine” beta feature. Once our code have passed this test case in the in-house test pass, we believe when the code is running in production, it will also correctly honor the enrollment status of the beta feature.

In both examples, we don’t need to run these test cases in production as a part of the live site monitoring.

The below chart illustrates the two reasons above (the scale is not in proportion):

monitoring != QA test automation

To be continued … (Part 2, Part 3)

Make Sense of the Test Results

Test automation per se is pretty common today. Few software companies are still hiring an army of manual testers (either regular employees or contractors).

However, the test results coming out of the test automation are usually still pretty raw. A typical test report today tells you that there are X test cases failed and Y passed. For each failed test case, the test report shows a brief error message (e.g. “AssertionFailed Timed Out waiting for status to be [Started]”) with a hyperlink to the full detail test log. That’s pretty much it. Beyond that point, from what I can see, people in many organizations are spending lots of time to make sense of the test results.

They want to figure out things like:

  • Among the failed test cases, whether the causes are all the same, or there are different causes for each failure?
  • Which failures are new failures vs. the chronic failure or flaky tests?
  • For a new failure, I want to quickly narrow down to one or two suspicious recent checkins?
  • For a chronic failure, is the failure this time the same kind as in the past, or the same test case but due to different cause?
  • Is the failure already being tracked by a bug? Is someone already working on it?
  • Is the failure supposed to be fixed? If so, the tracking bug should be reactivated since the fix didn’t seem to work.
  • Is the failure unique to my branch, or happening across the board? If it fails in other branches at the same time, it’s unlikely caused by changes in my branch and more likely an environment issue.

Besides understanding the failures, the engineers also care about the quality of the test automation:

  • Is the test pass taking longer time to finish than before? If so, why? Is that because: a) we have more test cases, b) the system-under-testing is now slower, c) a dependency of the system-under-testing is now slower, d) we are reaching the capacity limit of the test environment so things are getting queued/throttled, etc.
  • How is the repeatability of the test automation? What is the most flaky ones and what’s the reason?

Without help from good tools, the above analysis are laborious in many places today. No reason why we can’t use machines to perform these analysis and just put all the answers right in front of us soon after a test is finished. That shouldn’t be too hard. Most ideally, the machine can just tell us whether the build is good to ship or not. It’s very much like visiting hospitals for a general check-up. I don’t want to just get a pile of papers full of numbers, charts, etc., because I don’t know how to interpret them: is 42 bad or good for HDL cholesterol level? If bad, how bad it is? I have premature contractions? What does that mean? At the end, I just want to be told that “you are doing fine, just need to lose some weight”.

——

p.s. This reminds me of a TED talk that I watched recently. The speaker, Kenneth Cukier, said:

Big data is going to steal our jobs. Big data and algorithms are going to challenge white collar, professional knowledge work in the 21st century in the same way that factory automation and the assembly line challenged blue collar labor in the 20th century. Think about a lab technician who is looking through a microscope at a cancer biopsy and determining whether it’s cancerous or not. The person went to university. The person buys property. He or she votes. He or she is a stakeholder in society. And that person’s job, as well as an entire fleet of professionals like that person, is going to find that their jobs are radically changed or actually completely eliminated.

Well, long before machines can tell cancer cells from good cells and kill the lab technician’s job, we should be able to make machines help us make sense of the test results.